Richard Kersh, MEd, President of M.R.S. Health, Inc.
This article is a portion of a book titled “Challenges, Risks and Opportunities in Today’s Spine World ” edited by Stephen Hochschuler, MD, Frank Phillips, MD, and Richard Fessler, MD. You can find links to the previous chapters at the end of this article.
Introduction
It is important to understand the state of health and economics related to employer-sponsored health plans, due to the fact that over 150 million Americans are insured through employer-sponsored health insurance. Approximately 105 million Americans are provided health coverage by a self-insured employer health plan. When an employer is self-insured, this basically means that they are paying health care coverage from the first dollar spent out of their corporate budget. Employer-sponsored health care coverage is the largest employee-related expense; it accounts for 8% of an employee’s total compensation according to the Bureau of Labor statistics.
Self-insured employers are essentially required to manage another business unit, which is the provision of employee health care. In order to reduce health care related spending and reduce risk among their employer-sponsored health plans, employers are becoming proactive in creating countermeasures to escalating health care costs. One of the first steps in defining manageable risk within their populations is to utilize data analytics to identify risk mitigation opportunities. Within this brief overview, we will investigate how an employer can utilize data analytics to investigate one of their most expensive cost centers: musculoskeletal-related health care utilization.
Analysis
We began our investigation by utilizing data analytics to identify the economic burden associated with musculoskeletal diagnoses. This investigation looked at a typical employer’s data (i.e., medical and pharmacy claims data) over a 3-year period of time. This employer had a population of 28,957 individuals who utilized health care services. Figure 1 displays overall health care spending related to all diagnosis over a 3-year period.
Table 1:

Our next step in this analysis was to identify which diagnostic categories drove the majority of expenditures. As can be seen in Figure 2, musculoskeletal was the second most expensive diagnostic category.
Table 2:

The next questions to be answered were: How many people had a diagnosis code related to a musculoskeletal disorder? What was the impact of co-morbidities on their overall expenditures?
This view of the data can be seen in Figure 3. This data indicates the huge prevalence of musculoskeletal-related diagnoses and the economic impact.
Table 3:

The investigation of musculoskeletal diagnoses continued by calculating the number of lost days associated with specific musculoskeletal diagnoses. Lost time is another economic loss related to the employer’s health plan, and its burden must be added to health care expense related to treatment of the diagnosis. This impact can be seen in Figure 4.
Table 4:

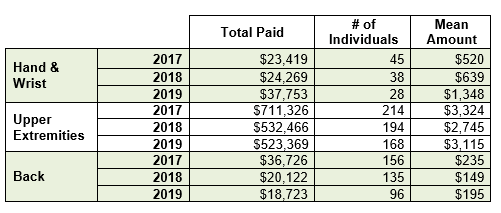
The next stage of analyzing the data investigated musculoskeletal diagnoses that could be potentially work-site-related or job-related. The results from this analysis can be seen in Figure 5.
Table 5:

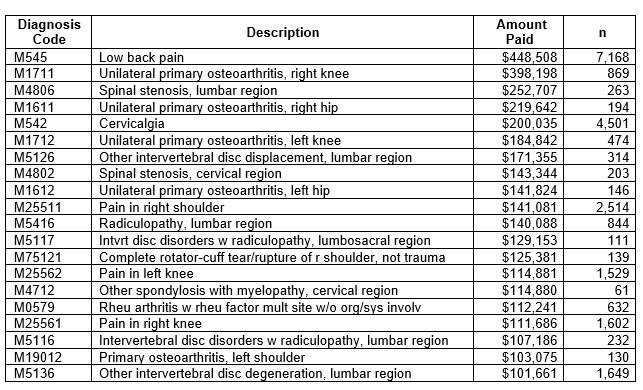
In order to better understand the source of the spending related to musculoskeletal diagnoses, the data was arranged to quantify the most expensive diagnoses. As can be seen in Figure 6, low back pain was the most expensive musculoskeletal diagnosis.
Table 6:

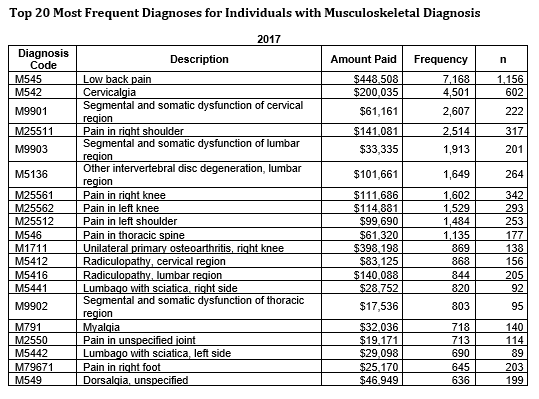
The frequency of musculoskeletal diagnoses was the next logical step to investigate within the data. Again, as can be seen in Figure 7, low back was identified as the most frequent musculoskeletal diagnosis related to this particular employer’s data set.
Table 7:

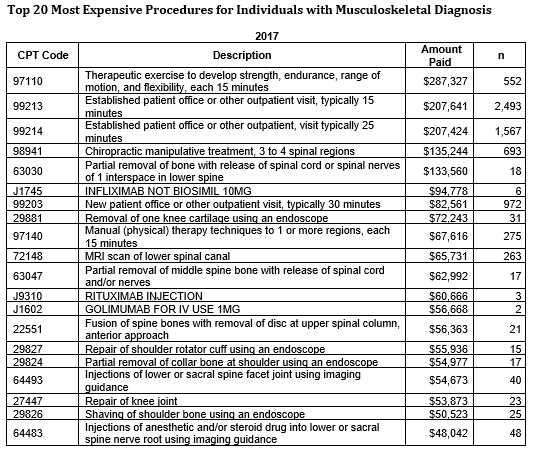
The investigation of the employer’s data set related to musculoskeletal diagnoses continued by identifying the most expensive procedures related to the treatment of musculoskeletal disorders. As can be seen in Figure 8, physical therapy was related to one of the most expensive procedures. The logical next question would be to investigate the outcomes related to physical therapy and determine which patient’s condition exacerbated into a necessary surgery or more expensive expenditure.
Table 8:

Conclusion
The results from this analysis demonstrate a logical progression of data interrogation that employers can utilize to better understand the underlying causes of their musculoskeletal expenditures. In order to capitalize on the learnings from the aforesaid analysis, employers should consider the following strategies:
• Establish early warning indicators within the data in order to act in a timely manner, (ex: diagnosis of low back pain, order for nuclear imaging of the spine, etc.). And consider the use of predictive modeling to identify risk promptly, in order to maximize treatment option.
• In partnership with a physician, establish clinical criteria to best triage and treat various musculoskeletal diagnosis, (i.e., evidence-based rules).
• Investigate outcomes based alternative treatment protocols for various musculoskeletal diagnosis
• Consider implementing various therapeutic lifestyle changes at the worksite, (i.e., exercise, nutrition, etc.). This helps to mitigate pre-cursors to musculoskeletal conditions by reducing risk factors that cause or exacerbate musculoskeletal conditions, (ex: obesity, inactivity, poor muscle strength & endurance, etc.).

