Measurement Period: June 2011 through December 2014
Report Delivery: April 17, 2015
Introduction
Ochsner HealthyBack, powered by Pure HealthyBack (PHB), is a health management solution for people with chronic back or neck pain. The Pure Solution provides a clinic–‐based, physician–‐ driven, and patient–‐centric approach that is redefining the way chronic back and neck pain is treated. PHB’s innovative and comprehensive care is delivered by expert teams comprised of highly qualified physicians, physical therapists, physical therapy assistants, exercise physiologists, and health and wellness coaches all working together to implement our leading–‐ edge treatment model—one that provides better care for individuals, improved health for the population, and reduced costs.
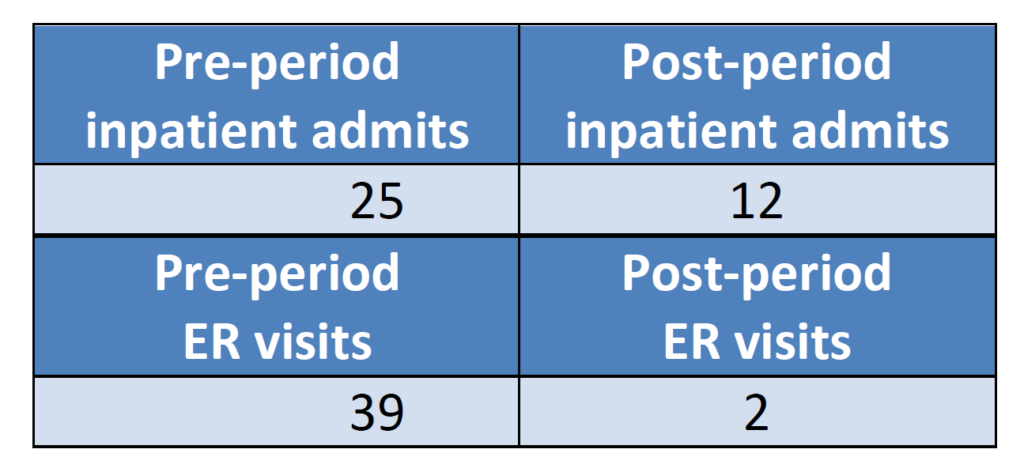
Claims–Based Results
Pure HealthyBack improves clinical outcomes and lowers avoidable utilization by addressing the critical interplay between chronic pain and overall physical health. Chronic pain conditions negatively impact quality of life and functionality, and they also impede adherence to all prescribed treatment plans and preclude optimal physiologic response to various treatment modalities. Effective identification and management of targeted patients result in overall reductions in health care services and associated costs. Ochsner HealthyBack opened its doors in November 2012 to serve program–‐eligible patients identified through the PHB identification process, which is described below. This report presents the financial savings with complete data sets either equal to or exceeding 12 months of post–‐period utilization and costs for all Ochsner HealthyBack patients beginning in June 2011 and concluding at the end of December 2014.
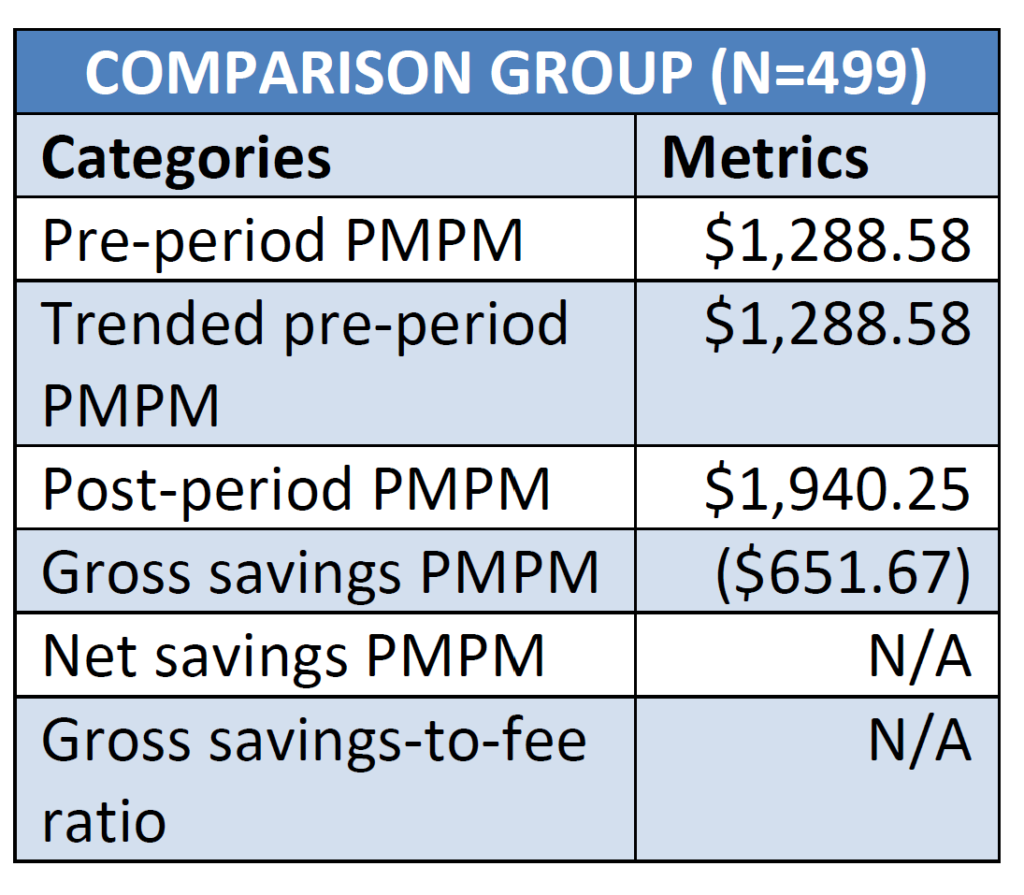
PHB Identification
Critical to program success is the identification of those who represent the greatest opportunity for change and impact. Through the collaborative PHB Identification process, prospective patients are selected using proprietary data analytics in combination with agreed upon inclusion/exclusion criteria. Health care claims and membership enrollment data are used to determine presence and severity of condition and eligibility for program enrollment, as well as financial performance and clinical outcomes over time.
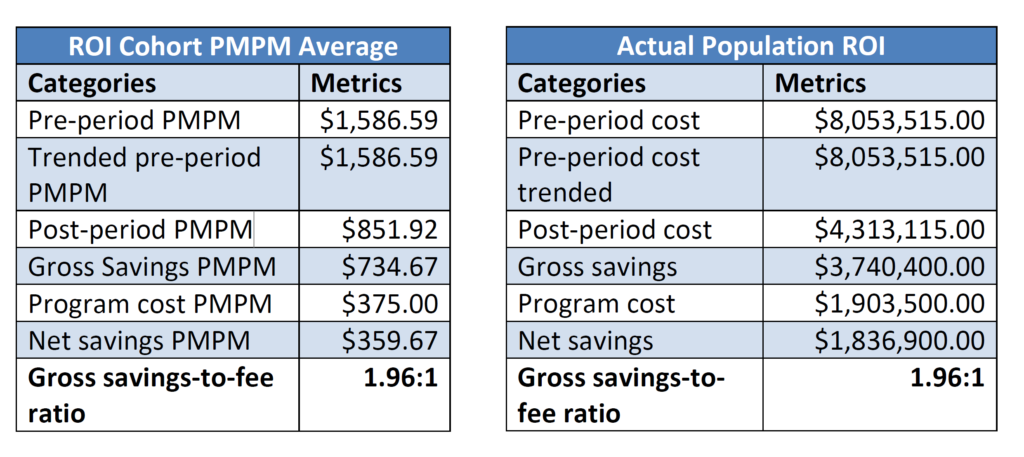
Return on Investment
Return on Investment (ROI) calculations are meant to summarize the financial benefits of the program in terms of the reduction in patient health care costs relative to program costs. To that end, the calculations are designed around understanding the costs (relative to each unique patient) prior to entering the program (a.k.a. the baseline period), how those costs change after entry into the program (a.k.a. the measurement period), and ultimately the savings after subtracting the costs for the program itself. A positive ROI is one where the patient costs, after subtracting the program fees, are less than what they would have been if nothing had changed from the baseline to measurement periods.